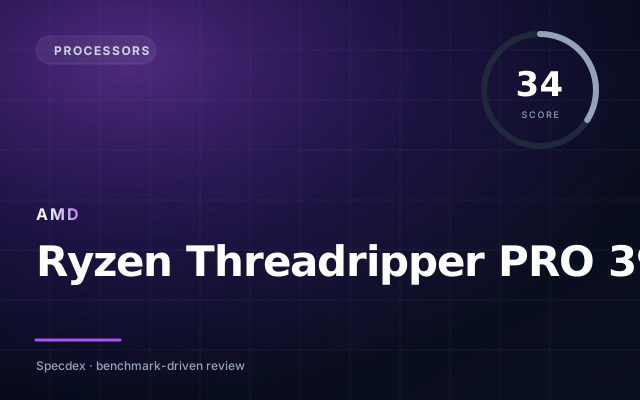
Ryzen Threadripper PRO 3975WX
32C/64T · 4.2 GHz · 280 W TDP · sWRX8 · PassMark #158
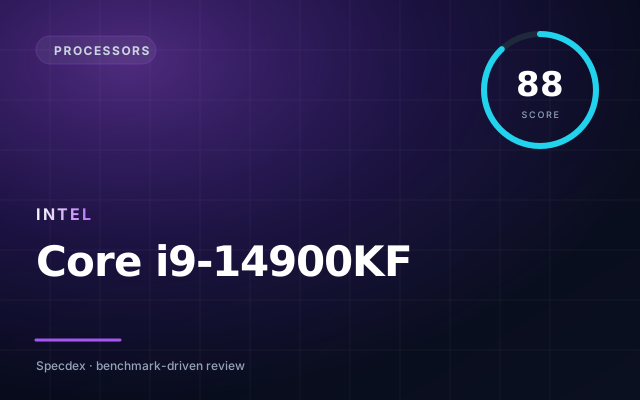
Core i9-14900KF
Raptor Lake Refresh · 24C/32T · 125 W · LGA1700
Core i9-14900KF takes it — here’s why.
In our weighted Specdex score, Ryzen Threadripper PRO 3975WX lands at 34 and Core i9-14900KF at 88. That puts Core i9-14900KF ahead by 54 points — a decisive margin driven mostly by its strengths in the categories below.
Pick Ryzen Threadripper PRO 3975WX if…
- ✓PassMark #158 of 5,901 — capable workhorse
- ✓Workstation-tier core counts for rendering and compilation
- ✓Current PassMark-tracked street price around $1,399
Pick Core i9-14900KF if…
- ✓Strong per-core performance
- ✓Hybrid P/E cores (12th gen+)
- ✓Wide platform availability
Winner by scenario
Derived from the sub-score breakdown · not a separate testValue for money
Core i9-14900KFSpecdex score per dollar at MSRP
Core i9-14900KF more score per dollar ($564 vs $1,399).
Score breakdown
Specs side-by-side
| Spec | Ryzen Threadripper PRO 3975WX | Core i9-14900KF |
|---|---|---|
| Cores | ▲ 32 | 24 |
| Threads | ▲ 64 | 32 |
| Base clock | 3.5 GHz | — |
| Boost clock | 4.2 GHz | — |
| L3 cache | 128 MB | — |
| TDP | 280 W | 125 W |
| Socket | sWRX8 | LGA1700 |
| Class | Desktop, Server | — |
| PassMark rank | #158 of 5,901 | — |
| PassMark CPU Mark | 62,226 | — |
| Architecture | — | Raptor Lake Refresh |
| Release year | — | 2023 |
Ryzen Threadripper PRO 3975WX
- +PassMark #158 of 5,901 — capable workhorse
- +Workstation-tier core counts for rendering and compilation
- +Current PassMark-tracked street price around $1,399
- −Workstation platform — overkill for gaming-only builds
- −Newer-generation parts pull ahead in current rankings
Core i9-14900KF
- +Strong per-core performance
- +Hybrid P/E cores (12th gen+)
- +Wide platform availability
- −Power draw on top SKUs
- −Frequent socket changes
- −Arrow Lake gaming regressions
FAQ: Ryzen Threadripper PRO 3975WX vs Core i9-14900KF
Which is better, Ryzen Threadripper PRO 3975WX or Core i9-14900KF? +
Core i9-14900KF scores 88 on our weighted rubric — ahead by 54. Your best pick depends on the sub-scores above.
Is Ryzen Threadripper PRO 3975WX worth the price? +
At $1,399, Ryzen Threadripper PRO 3975WX delivers a Specdex score of 34 — strongest in passmark.
Is Core i9-14900KF worth the price? +
At $564, Core i9-14900KF delivers a Specdex score of 88 — strongest in single.
Does Ryzen Threadripper PRO 3975WX or Core i9-14900KF last longer? +
Based on our long-term update and support ratings, both ship with multi-year support. Battery and reliability scores are visible in the breakdown above.
Which is the better value, Ryzen Threadripper PRO 3975WX or Core i9-14900KF? +
Core i9-14900KF — more score per dollar ($564 vs $1,399). Specdex score per dollar at MSRP.