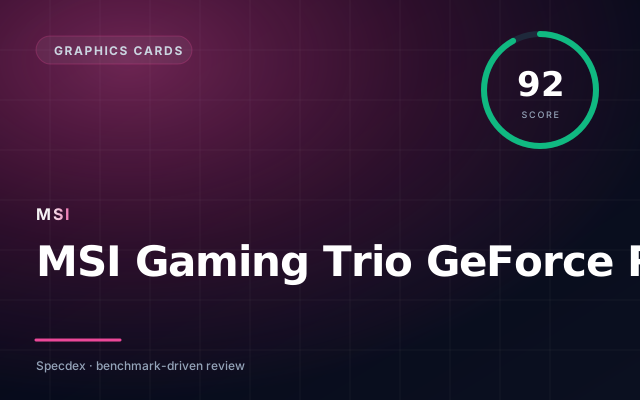
MSI Gaming Trio GeForce RTX 4080
Ada · 16 GB GDDR6X · 320 W · Gaming Trio
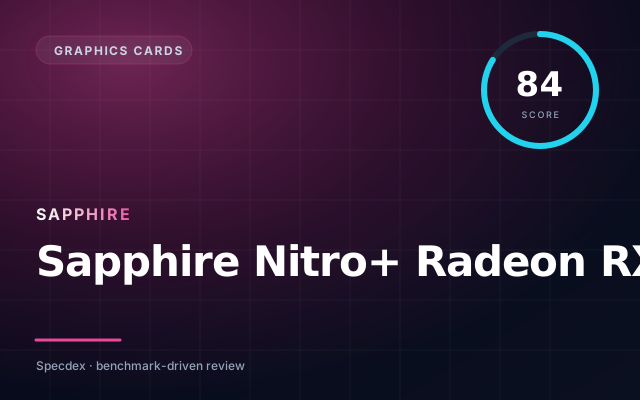
Sapphire Nitro+ Radeon RX 6950 XT
RDNA 2 · 16 GB GDDR6 · 335 W · Nitro+
MSI Gaming Trio GeForce RTX 4080 takes it — here’s why.
In our weighted Specdex score, MSI Gaming Trio GeForce RTX 4080 lands at 92 and Sapphire Nitro+ Radeon RX 6950 XT at 84. That puts MSI Gaming Trio GeForce RTX 4080 ahead by 8 points — a decisive margin driven mostly by its strengths in the categories below.
Pick MSI Gaming Trio GeForce RTX 4080 if…
- ✓NVIDIA driver stack
- ✓DLSS support on RTX
- ✓Strong resale value
Pick Sapphire Nitro+ Radeon RX 6950 XT if…
- ✓More VRAM at price tier
- ✓FSR support
- ✓Driver open-source on Linux
Winner by scenario
Derived from the sub-score breakdown · not a separate test4K & rasterization
MSI Gaming Trio GeForce RTX 4080Traditional rendering throughput at high resolution
MSI Gaming Trio GeForce RTX 4080 leads on raster (92 vs 84).
Ray tracing
MSI Gaming Trio GeForce RTX 4080RT-heavy titles with path-traced lighting
MSI Gaming Trio GeForce RTX 4080 leads on rt (87 vs 74).
AI workloads
MSI Gaming Trio GeForce RTX 4080Local inference, upscaling, generative tools
MSI Gaming Trio GeForce RTX 4080 leads on ai (89 vs 69).
Power efficiency
Sapphire Nitro+ Radeon RX 6950 XTFrames per watt — heat, noise, and PSU sizing
Sapphire Nitro+ Radeon RX 6950 XT leads on efficiency (77 vs 73).
Value for money
TieSpecdex score per dollar at MSRP
Effectively tied — similar score-per-dollar at MSRP.
Score breakdown
Specs side-by-side
| Spec | MSI Gaming Trio GeForce RTX 4080 | Sapphire Nitro+ Radeon RX 6950 XT |
|---|---|---|
| Architecture | Ada | RDNA 2 |
| VRAM | 16 GB GDDR6X | 16 GB GDDR6 |
| TBP | 320 W | 335 W |
| Release year | 2022 | 2022 |
MSI Gaming Trio GeForce RTX 4080
- +NVIDIA driver stack
- +DLSS support on RTX
- +Strong resale value
- −Power draw scales with tier
- −Gen-over-gen price creep
- −VRAM gated per tier
Sapphire Nitro+ Radeon RX 6950 XT
- +More VRAM at price tier
- +FSR support
- +Driver open-source on Linux
- −RT trails NVIDIA
- −AI ecosystem smaller
- −Driver day-0 bugs
FAQ: MSI Gaming Trio GeForce RTX 4080 vs Sapphire Nitro+ Radeon RX 6950 XT
Which is better, MSI Gaming Trio GeForce RTX 4080 or Sapphire Nitro+ Radeon RX 6950 XT? +
MSI Gaming Trio GeForce RTX 4080 scores 92 on our weighted rubric — ahead by 8. Your best pick depends on the sub-scores above.
Is MSI Gaming Trio GeForce RTX 4080 worth the price? +
At $1,344, MSI Gaming Trio GeForce RTX 4080 delivers a Specdex score of 92 — strongest in raster.
Is Sapphire Nitro+ Radeon RX 6950 XT worth the price? +
At $1,128, Sapphire Nitro+ Radeon RX 6950 XT delivers a Specdex score of 84 — strongest in raster.
Does MSI Gaming Trio GeForce RTX 4080 or Sapphire Nitro+ Radeon RX 6950 XT last longer? +
Based on our long-term update and support ratings, both ship with multi-year support. Battery and reliability scores are visible in the breakdown above.
Which is better for 4K gaming, MSI Gaming Trio GeForce RTX 4080 or Sapphire Nitro+ Radeon RX 6950 XT? +
MSI Gaming Trio GeForce RTX 4080 — leads on raster (92 vs 84). Traditional rendering throughput at high resolution.
Which is better for ray tracing, MSI Gaming Trio GeForce RTX 4080 or Sapphire Nitro+ Radeon RX 6950 XT? +
MSI Gaming Trio GeForce RTX 4080 — leads on rt (87 vs 74). RT-heavy titles with path-traced lighting.